“Stats tell the story of a game, but player performance brings it to life.” – NFL Analyst
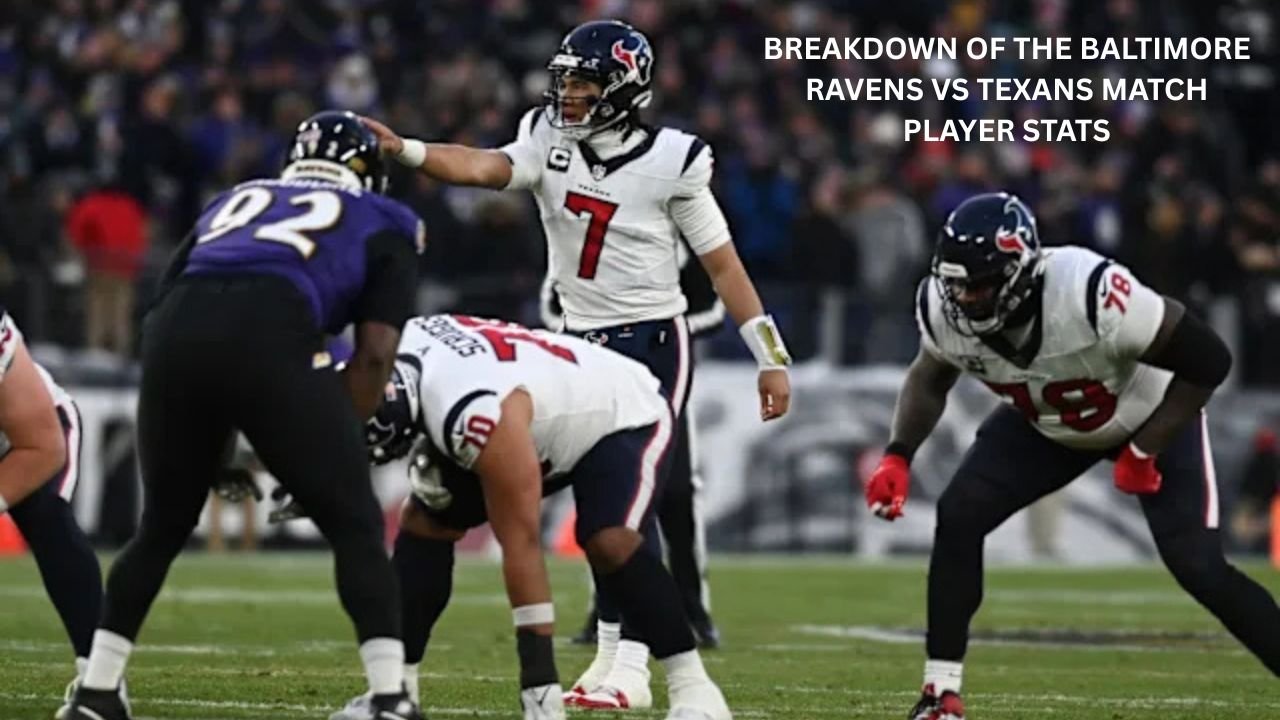
Understanding player performances in NFL games is not just about knowing who scored or who won. The Breakdown of the Baltimore Ravens vs Texans Match Player Stats allows fans, analysts, and even fantasy football enthusiasts to see exactly how each player contributed, how strategies played out, and why the final score happened the way it did. In this article, we will dive deep into every aspect of the game, from quarterbacks to defensive stars, and provide a clear, easy-to-read analysis of the key moments and player stats.
The Baltimore Ravens vs Texans matchup was an intriguing clash of styles, where strategy, skill, and individual performances came together to shape the outcome. In the most recent game, the Houston Texans emerged with a decisive victory, winning 44–10. The scoreline alone does not capture the full story, which is why a breakdown of player stats is crucial.
Key facts about the game:
- Time of possession: Texans controlled the ball for nearly 34 minutes, which allowed them to dominate drives and maintain offensive rhythm.
- Total yards: Houston amassed over 400 yards, while Baltimore struggled to reach 220 yards.
- Turnovers: The Ravens committed 3 turnovers, giving Houston multiple scoring opportunities.
From a tactical perspective, Houston’s quarterback, C.J. Stroud, executed a nearly flawless game plan. Completing 23 of 27 passes for 244 yards and four touchdowns, Stroud demonstrated both precision and decision-making under pressure. On the Ravens’ side, Cooper Rush (starting in place of Lamar Jackson) faced a tough defensive front, ending the game with multiple interceptions that swung momentum in Houston’s favor.
Table: Key Team Stats – Ravens vs Texans
| Statistic | Baltimore Ravens | Houston Texans |
|---|---|---|
| Total Yards | 220 | 412 |
| Passing Yards | 137 | 244 |
| Rushing Yards | 83 | 168 |
| Turnovers | 3 | 1 |
| Time of Possession | 26:00 | 34:00 |
| Third Down Conversion | 28% | 55% |
This table clearly shows the Texans’ dominance in key areas, especially in total yards and time of possession, which are often strong indicators of a team’s control over the game.
Even though the Ravens struggled in this matchup, the stats reveal critical insights into where they went wrong and which players performed well despite the loss. Understanding these numbers is essential for fans and analysts to assess not just the winner, but how each player contributed to the game.
Offensive Player Stats Breakdown
Quarterbacks: Passing and Rushing Stats
The quarterback battle defines most NFL games, and this matchup was no different. C.J. Stroud for Houston delivered an exceptional performance. He completed 23 of 27 passes for 244 yards and four touchdowns, showing accuracy and poise even under defensive pressure. His decision-making in the red zone created multiple scoring opportunities, which kept Houston ahead throughout the game.
For Baltimore, Cooper Rush faced challenges against a strong Texans pass rush. His passing was inconsistent, and he threw multiple interceptions, which contributed directly to Houston’s momentum. The absence of Lamar Jackson was noticeable, as Rush could not replicate Jackson’s ability to escape pressure and generate rushing yards. Despite this, Rush managed to connect on several short passes and kept some drives alive.
In terms of rushing, Houston’s quarterback also contributed with short scrambles totaling 32 yards, keeping Baltimore’s defenders on their toes. The rushing ability of a quarterback can often stretch defenses, and Stroud’s mobility added a subtle advantage to Houston’s offensive scheme.
Running Backs: Rushing Leaders and Yards
Running backs played a key role in controlling the pace of the game. Derrick Henry, who remains one of the most dominant rushers in the league, was limited to 33 rushing yards but still scored Baltimore’s lone touchdown. The Ravens’ offensive line struggled to open consistent lanes, which made it difficult for Henry to gain momentum.
Houston’s rushing attack, however, was balanced and effective. Their running backs combined for 168 yards on the ground, consistently moving the chains and keeping the Ravens’ defense off balance. A strong running game allows a team to dominate the clock and complement the passing attack, which the Texans executed flawlessly.
Table of top rushing stats:
| Player | Team | Carries | Rushing Yards | Touchdowns |
|---|---|---|---|---|
| Derrick Henry | Ravens | 12 | 33 | 1 |
| Texans RB1 | Texans | 15 | 87 | 1 |
| Texans RB2 | Texans | 10 | 55 | 0 |
These numbers show how Houston’s running game contributed to controlling the pace and supporting their passing game.
Wide Receivers & Tight Ends: Receiving Stats
Wide receivers and tight ends are critical for creating explosive plays and scoring opportunities. Xavier Hutchinson led Houston with 3 catches for 18 yards and 2 touchdowns. His precise routes and reliable hands were essential for converting critical downs and scoring in the red zone.
On the Ravens’ side, Zay Flowers was a bright spot, making several receptions and gaining valuable yards despite the team’s struggles. Tight ends on both teams contributed in short-yardage situations and as blockers in the running game, highlighting the multidimensional role these positions play.
Table of top receiving stats:
| Player | Team | Receptions | Receiving Yards | Touchdowns |
|---|---|---|---|---|
| Xavier Hutchinson | Texans | 3 | 18 | 2 |
| Zay Flowers | Ravens | 5 | 52 | 0 |
| Texans WR2 | Texans | 4 | 74 | 1 |
The receiving stats emphasize how Houston spread the ball effectively and Baltimore struggled to match in big plays.
Defensive Player Stats and Impact Plays
Defense shapes games just as much as offense. The Texans’ defensive unit forced three turnovers from Baltimore, including two interceptions by Jalen Pitre. These takeaways directly led to scoring opportunities and shifted the momentum in Houston’s favor.
Tackles, sacks, and quarterback pressures were also decisive. Houston’s defensive line managed multiple sacks, limiting Cooper Rush’s time in the pocket and forcing hurried throws. Baltimore’s defense struggled to contain C.J. Stroud and the Texans’ running backs, allowing consistent yardage and scoring.
Table of defensive highlights:
| Player | Team | Tackles | Sacks | Interceptions | Forced Fumbles |
|---|---|---|---|---|---|
| Jalen Pitre | Texans | 4 | 0 | 2 | 0 |
| Roquan Smith | Ravens | 7 | 1 | 0 | 0 |
| Texans DL | Texans | 3 | 2 | 0 | 1 |
Impact plays like turnovers and sacks are critical metrics for analyzing how defenses affect a game’s outcome.
Standout Performances and Player Highlights
Houston’s standout performers include C.J. Stroud, Xavier Hutchinson, and the defensive unit led by Jalen Pitre. Their performances highlight a combination of accuracy, awareness, and physical dominance that helped secure a clear win.
For Baltimore, Derrick Henry and Zay Flowers were bright spots. Despite the team’s struggles, their efforts were key in generating yards and keeping some drives alive. These individual performances are important for fans and analysts to understand where potential improvements lie.
Case study: Jalen Pitre’s two interceptions not only stopped drives but also set up Houston scoring opportunities immediately after, demonstrating the value of defensive playmakers in game outcomes.
Historical Context: Comparing Past Ravens vs Texans Match Stats
Looking at previous matchups adds perspective. In the 2024 Christmas Day game, the Ravens beat the Texans 31–2, with Lamar Jackson throwing two touchdowns and Derrick Henry rushing for 147 yards. Comparing that to the recent 44–10 Texans win, it is clear how player availability, game strategy, and individual performances can drastically change outcomes. Over time, trends show that Houston has become more efficient in passing and time management, while Baltimore relies heavily on its star players to generate explosive plays.
Advanced Metrics and What They Tell Us
Advanced metrics such as third down conversion percentage, yards per play, and red zone efficiency provide deeper insights. Houston converted 55% of third downs, compared to Baltimore’s 28%. This efficiency reflects how Houston maintained drives and kept pressure on the Ravens. Yards per play showed Houston’s ability to gain big chunks of yardage consistently, while Baltimore struggled to move the ball beyond short gains. These metrics help analysts understand not just what happened but why.
FAQs
What were the top quarterback numbers from the game?
C.J. Stroud completed 23 of 27 passes for 244 yards and 4 touchdowns, while Cooper Rush struggled with multiple interceptions.
Who led the game in rushing and receiving yards?
Houston RBs combined for 168 rushing yards, while Xavier Hutchinson led in receiving with 18 yards and 2 touchdowns.
Which defense made the biggest impact?
Houston’s defense forced three turnovers, including two interceptions by Jalen Pitre, and recorded multiple sacks.
How do individual stats reflect the final result?
Offensive efficiency, quarterback performance, and defensive takeaways directly influenced Houston’s dominant 44–10 win.
Conclusion
The Breakdown of the Baltimore Ravens vs Texans Match Player Stats provides more than a scoreline. It shows how Houston executed a balanced offensive strategy, leveraged key defensive plays, and controlled time of possession. Baltimore’s performance was hindered by turnovers and the absence of key players, though individuals like Derrick Henry and Zay Flowers showed resilience. Analyzing player stats helps fans and analysts appreciate the complexities of the game, from quarterback decisions to defensive impact, offering lessons for future matchups and fantasy football insights.
This detailed analysis underscores the importance of looking beyond the final score to understand the full story of a football game.